Profiling & Memory
Effective memory management and performance profiling are critical for running large models in the browser. torch.js provides both deterministic cleanup via scopes and low-level tools to monitor GPU usage.
1. Automatic Memory Management (Scopes)
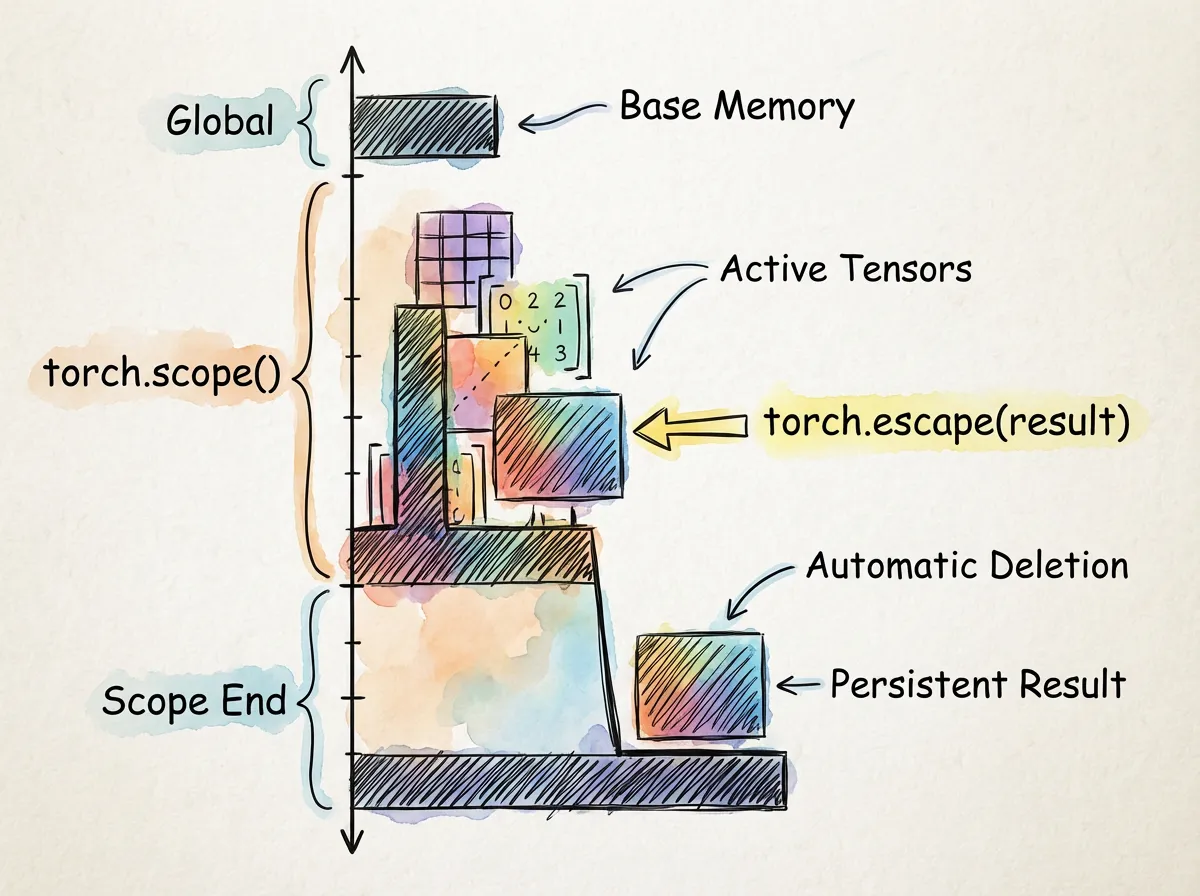
The most powerful feature for memory management in torch.js is the Scope API. This allows you to define a block of code where all temporary tensors are automatically destroyed when the block exits.
torch.scope()
Use scopes to prevent intermediate tensors (like those created during a forward or backward pass) from leaking into GPU memory.
import torch from '@torchjsorg/torch.js';

// All tensors created inside this function will be destroyed automatically
const result = torch.scope(() => {
  const x = torch.randn([1024, 1024]);
  const y = x.matmul(x.t());
  const loss = y.sum();

  // Use torch.escape to keep a specific tensor alive outside the scope
  return torch.escape(loss);
});
torch.escape()
If you need to return a tensor from a scope, you must explicitly "escape" it. Otherwise, it will be destroyed along with all other tensors in that scope.
2. Low-Level Memory Control
While scopes handle most cases, you sometimes need direct control over GPU resources.
Explicit Deletion
You can manually free a tensor's memory at any time by calling .delete().
const largeTensor = torch.randn(1024, 1024);
// ... use tensor ...
largeTensor.delete(); // Free GPU VRAM immediately
Memory Statistics
Monitor the current state of the GPU memory pool using torch.webgpu.memory_stats() (or torch.cuda.memory_stats() for PyTorch compatibility).
| Stat | Description |
|---|---|
| active_bytes | Memory currently used by active tensors |
| pooled_bytes | Memory cached in the pool for reuse |
| peak_bytes | The maximum memory allocated since last reset |
const stats = torch.webgpu.memory_stats();
console.log(torch.webgpu.memory_summary()); // Print a human-readable table
Clearing the Cache
Use torch.webgpu.empty_cache() to release all pooled (unused) memory back to the system.
3. Profiling Performance
The torch.profiler module allows you to measure the execution time of individual operations and layers.
Basic Profiling
Wrap your code in a profile block to capture timing data.
import { profiler } from '@torchjsorg/torch.js';

const prof = await profiler.profile(async () => {
  const output = model.forward(input);
  output.backward();
});

// Print a formatted table of execution times
console.log(prof.key_averages().table());
Awaiting stop: If you use the manual start() and stop() methods, you must await profiler.stop() to ensure all GPU commands have finished before reading timings.
Cleanup Method Comparison
| Method | Best For | Behavior |
|---|---|---|
| torch.scope() | Loops / Passes | Automatic, deterministic cleanup of all temps |
| .delete() | Manual cleanup | Immediate destruction of a single tensor |
| empty_cache() | Reducing footprint | Releases pooled memory back to the OS |
| Finalization | Safety net | Non-deterministic GC fallback |
Next Steps
- Performance Guide - High-level optimization strategies.
- Best Practices - Coding patterns for efficient WebGPU use.