Training Dashboards
A core use case for react-ui is building interactive training loops that give researchers and developers immediate visual feedback on their models.
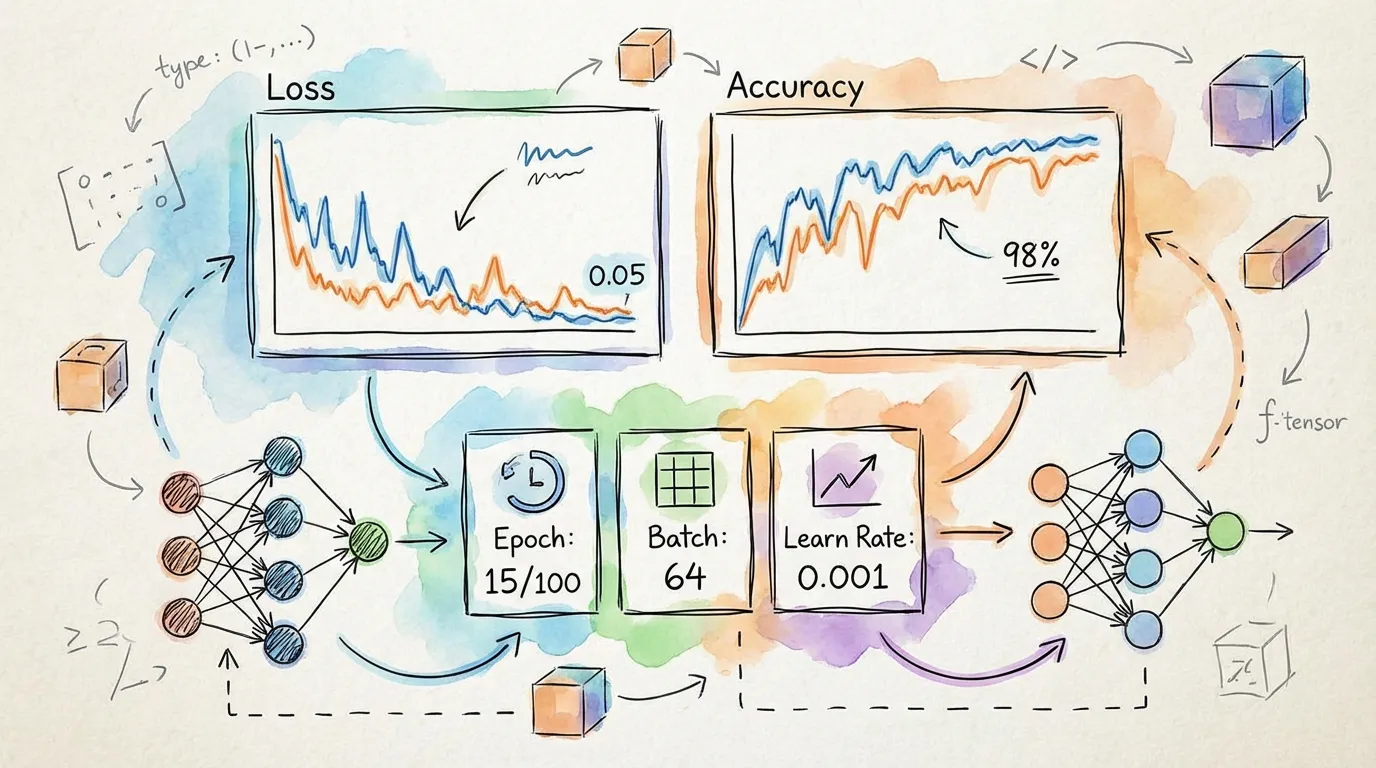
Key Components
To build a standard dashboard, you typically combine four components:
GPUStreamingChart: Renders real-time loss and accuracy curves.TrainingControls: Provides play, pause, and reset buttons.TrainingStats: Displays numeric metrics like epoch and current loss.ParamSlider: Allows adjusting hyperparameters (like learning rate) mid-flight.
Implementation Example
import { useRef, useState } from 'react';
import {
  GPUStreamingChart,
  TrainingControls,
  TrainingStats,
  ParamSlider,
} from '@torchjsorg/react-ui';

function Dashboard() {
  const chartRef = useRef(null);
  const [status, setStatus] = useState('idle');
  const [lr, setLr] = useState(0.001);

  // Example update function called from your training loop
  const onBatchEnd = (loss: number, accuracy: number) => {
    chartRef.current?.append([loss, accuracy]);
  };

  return (
    <div className="flex flex-col gap-6 p-6 border rounded-xl bg-card">
      <div className="flex items-center justify-between">
        <TrainingStats epoch={10} loss={0.42} accuracy={0.89} />
        <TrainingControls
          status={status}
          onStart={() => setStatus('training')}
          onPause={() => setStatus('paused')}
        />
      </div>

      <GPUStreamingChart ref={chartRef} seriesNames={['Loss', 'Accuracy']} height={240} />

      <ParamSlider label="Learning Rate" value={lr} min={0.0001} max={0.01} onChange={setLr} />
    </div>
  );
}
Integration with Spark
Training dashboards are most effective when paired with Spark. This allows your model to train in a background Web Worker while the UI stays responsive at 60fps.
See the Spark Introduction for details on how to connect reactive worker state to these UI components.
Best Practices
- Batch Updates: Avoid calling
append()on your chart more than 10-20 times per second to keep the UI smooth. - Use GPU Charts: For training sessions lasting thousands of iterations, always prefer
GPUStreamingChartover standard SVG charts to maintain performance. - Theme Sensitivity: All components automatically adapt to the
darkandlightmode of your application.